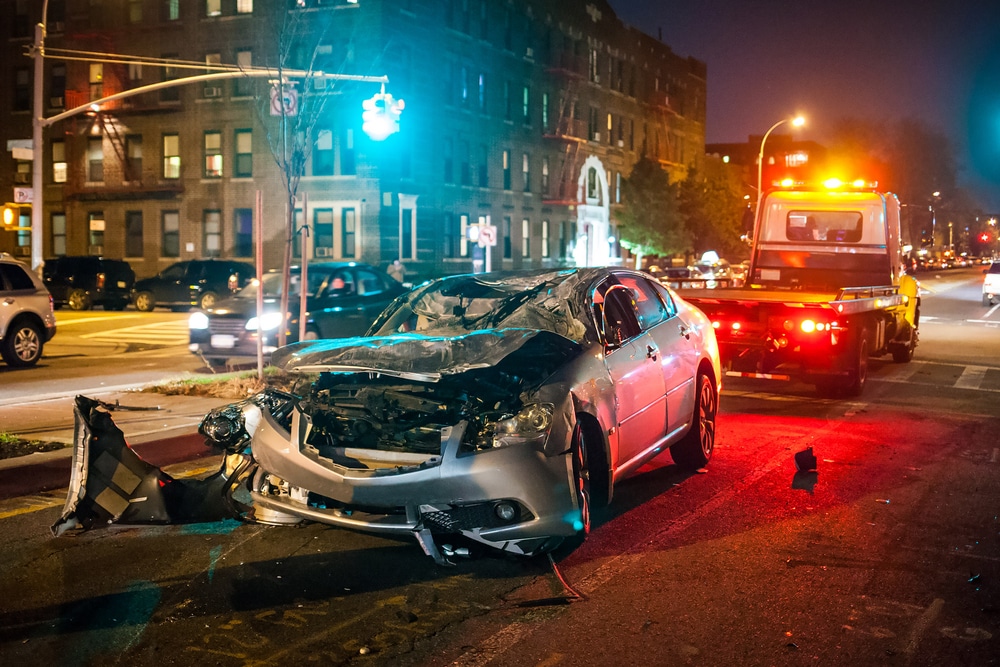
Car accident statistics reveal critical insights into fatalities across various types of accidents, underscoring the importance of targeted safety measures. It’s essential to refer to car statistics more often to stay informed about these trends. Here are key insights:
1. Car Accident Statistics: Annual
Annual Incidents:
In the United States, over 6 million traffic accidents are reported annually. These accidents vary in severity, from minor fender-benders to catastrophic crashes. The high number of accidents underscores the prevalence of road-related risks, even as vehicles become safer and roadways are improved. Each year, millions of drivers, passengers, and pedestrians are involved in traffic incidents, leading to injuries, fatalities, and significant economic costs.
Annual Fatalities: Traffic fatalities are a tragic and ongoing issue. Road traffic deaths worldwide reached 1.35 million in 2018, up from 1.15 million in 2000. The U.S. saw more than 42,000 fatalities in 2021 alone, making motor vehicle accidents a leading cause of death in the country. Of the 56.9 million deaths worldwide, road traffic injuries account for 2.37%, the eight cause of global death.
2. Car Accident Statistics: Rate by Various Factors
- Speeding: One of the most common contributing factors to fatal accidents. According to car accident statistics from NHTSA, speeding causes approximately 18.5% of all fatal crashes, which resulted in 12,151 deaths in 2022. Speeding reduces a driver’s reaction time, impairs judgment, and increases the severity of crashes. Reducing speed limits, increasing enforcement, and promoting safe driving education can help curb speeding-related fatalities.
- Impaired Driving: Alcohol and drug-related incidents continue to be a significant cause of traffic fatalities. In 2022, impaired driving was responsible for 11.2% of all traffic deaths, totaling 13,524 fatalities. Car accident statistics show that alcohol-related crashes alone account for a substantial portion of this, leading to roughly 37 deaths daily due to drunk driving. The prevalence of drug-impaired driving, including prescription and recreational drugs, also poses a growing threat, with 56% of drivers in fatal accidents testing positive for at least one drug.
- Distracted Driving: Remains one of the deadliest and most preventable causes of accidents. In 2022, 3,308 fatalities were caused by distracted driving, which accounts for 5.5% of all traffic deaths. Texting while driving, using in-car infotainment systems, and talking on the phone are common distractions that impair a driver’s focus on the road, increasing the likelihood of accidents.
- Drowsy Driving: Contributed to 693 deaths in 2022. Fatigued drivers experience slowed reaction times and impaired judgment, similar to the effects of alcohol consumption. According to research, drowsy driving is a factor in about 20% of all accidents, but only a fraction of these are reported or recognized as such.
- Drug-Impaired Driving: Drugs, whether prescription, over-the-counter, or recreational, are involved in a significant number of traffic accidents. In 2022, 56% of drivers involved in fatal crashes tested positive for at least one drug. The rise in drug use, including opioids, marijuana, and other substances, makes it even more critical to address this issue through better enforcement, education, and prevention strategies.
- Weather Conditions: Adverse weather conditions play a major role in traffic accidents. For instance, rain and fog increase the risk of crashes, leading to approximately 21% of all weather-related traffic accidents. Reduced visibility, slippery roads, and longer braking distances make driving in these conditions particularly hazardous. Drivers must adjust their behavior to these conditions by reducing speed, increasing following distance, and ensuring proper tire maintenance.
- High-Risk Times and Locations: Certain times of day, particularly weekends and nighttime hours, are associated with a higher frequency of fatal accidents. More than 50% of teen fatalities occur between 6 p.m. and 3 a.m., when factors like alcohol consumption, fatigue, and impaired judgment are prevalent. Additionally, urban areas with higher traffic volumes and reduced visibility have a higher incidence of pedestrian accidents and crashes involving motor vehicles.
Refer to the NHTSA risky driving for more information on Speeding, Distracted, Drunk, Drowsy or Drug-impaired driving.
3. Fatality Car Accident Statistics
The overall fatality rate in the U.S. is 1.37 deaths per 100 million miles traveled.
Let’s compare with other accident types:
- Car Accidents: Car accidents are responsible for approximately 35% of all traffic fatalities. In 2021, there were over 42,000 deaths from car crashes, highlighting the dangers of distracted driving, speeding, and driving under the influence.
- Bus Accidents: Bus accidents, though less frequent, can have devastating impacts. They account for about 0.1% of all traffic fatalities, but when they occur, the fatality rate is often higher due to the larger number of passengers involved. Car accident statistics for 2021 indicate bus-related fatalities reached around 260.
- Truck Accidents: Large trucks (including semi-trucks) are involved in roughly 9% of fatal crashes, with approximately 5,600 deaths attributed to truck accidents in 2021. Car accident statistics indicate these accidents often result from factors such as driver fatigue, poor vehicle maintenance, and unsafe driving practices.
- Motorcycle Accidents: Motorcyclists are particularly at risk, representing 14% of all traffic fatalities despite being a small percentage of total vehicle registrations. In 2021, over 5,500 motorcyclists lost their lives, with the fatality rate for motorcyclists being five times higher than for passenger car occupants.
- Pedestrian Accidents: Pedestrian fatalities have seen a worrying increase, with over 7,300 deaths in 2021. Pedestrians account for approximately 17% of all traffic fatalities, and the risk is higher in urban areas where traffic density is greater and visibility is often reduced.
- Boating Accidents: While not a roadway statistic, boating accidents also pose a significant risk. In 2021, there were 658 fatalities due to boating accidents, with the majority of incidents attributed to operator inattention, lack of safety equipment, and alcohol use.
- Bicycle Accidents: Bicycle accidents accounted for approximately 800 fatalities in 2021, making up about 2% of total traffic deaths. These accidents often involve collisions with motor vehicles and highlight the need for improved infrastructure and safety measures for cyclists.
- Slip and Fall Accidents: Although not typically categorized with traffic accidents, slip and fall incidents contribute significantly to injury statistics. These accidents result in around 17,000 fatalities annually, often occurring in public spaces and workplaces. The cost of non-fatal slip and fall injuries is substantial, with an average societal cost of about $30,000 per incident.
4. Economic Costs of a Car Accident
The financial burden of traffic accidents is significant, costing the U.S. economy about $340 billion annually. This includes medical expenses, lost productivity, and property damage, which together add up to $1,035 per person every year. The car accident statistics for the economic toll of alcohol-related crashes alone indicate that these crashes cost about $141 per person each year.
Costs of Alcohol-Involved Crashes
Alcohol-related crashes impose a particularly heavy economic toll. These crashes cost approximately $141 per person each year. This includes not only direct costs like medical bills and vehicle repairs but also indirect costs such as lost work productivity and long-term care for victims of serious accidents.
Costs of Non-Fatal Injuries
Non-fatal injuries from traffic accidents create a massive financial burden, with each injury costing an average of $162,000. This includes the cost of medical treatment, rehabilitation, lost wages, and long-term care for severely injured individuals. These costs can escalate for more serious injuries, leading to long-term financial challenges for both victims and society as a whole.
Costs of Fatal Accidents
The societal cost per fatality is even higher, estimated at over $1.869 million per death. This figure accounts for not only the immediate medical costs and lost productivity but also the long-term impact on families and communities. It underscores the importance of investing in preventive measures to reduce traffic deaths and alleviate the significant economic toll these incidents cause.
5. Comparison of Vehicle Characteristics: Age, Size, and Cost
The type of vehicle and its age, size, and safety features significantly impact the likelihood of being involved in a fatal accident. Car accident statistics show that cars aged 10 years or older are twice as likely to be involved in fatal crashes compared to newer models, primarily due to fewer modern safety features.
- Older vs. Newer Cars:
Cars aged 10 years or older are twice as likely to be involved in fatal crashes compared to newer models. This increased risk is primarily due to fewer modern safety features, such as electronic stability control (ESC) and advanced airbags. For example, vehicles manufactured before 2010 often lack ESC, which can significantly reduce the likelihood of losing control in critical situations. Data shows that the fatality rate for older cars is about 22 deaths per million registered vehicles, while newer models, equipped with better safety technology, see a much lower rate. - Large vs. Small Vehicles:
Larger vehicles, such as SUVs and trucks, provide better protection for their occupants. The death rate for larger vehicles is around 28 deaths per million registered vehicles, compared to 60 deaths for smaller cars. However, it’s important to note that the size and weight of larger vehicles can contribute to higher fatalities for pedestrians. In fact, larger vehicles are more likely to be involved in pedestrian accidents, resulting in a fatality rate for pedestrians that is 2.5 times higher compared to smaller cars. - Luxury vs. Economy Models:
Car accident statistics show that luxury vehicles generally demonstrate lower fatality rates due to their advanced safety systems and technology. For example, luxury models such as the Lexus RX and Volvo XC90 maintain some of the lowest fatality rates in the industry, often attributed to features like adaptive cruise control, automatic emergency braking, and enhanced structural integrity. Conversely, budget models, such as the Mitsubishi Mirage, exhibit higher driver fatality rates, primarily due to fewer safety features and lower crash-test ratings. Data indicates that budget vehicles can have fatality rates exceeding
These car accident statistics are a stark reminder of the importance of road safety. From the impact of speeding and impaired driving to the rising fatalities among pedestrians and motorcyclists, these numbers tell a story that demands action. By investing in safer vehicles, improving infrastructure, and continuing to educate the public about the dangers of distracted and impaired driving, society can work towards reducing the devastating toll that traffic accidents take every year.
For further information on car accident statistics, refer to the sources below:
- National Highway Traffic Safety Administration (NHTSA): NHTSA
- Insurance Institute for Highway Safety (IIHS): IIHS
- Centers for Disease Control and Prevention (CDC): CDC
- Federal Motor Carrier Safety Administration (FMCSA): FMCSA
- National Safety Council (NSC): NSC
Accident?
Our team of experienced car accident lawyers is ready to help you assess your case via car accident statistics and fight for the compensation you deserve. Don’t let the negligence of others dictate your future—let us be your advocate in this challenging time.


