Traffic statistics reveal critical insights into fatalities across various types of accidents, underscoring the importance of targeted safety measures. It’s essential to refer to traffic statistics more often to stay informed about these trends. Here are key insights based on accident types:
1. Accident Rates and Causes
- Annual Incidents: In 2022, there were approximately 42,400 road fatalities in the U.S., with a noticeable rise attributed to factors like distracted and impaired driving.
- Primary Causes: Speeding contributes to around 18.5% of all fatal accidents, impaired driving accounts for 11.2%, and distracted driving is responsible for 5.5%. DUI-related crashes lead to around 14,219 fatalities annually.
- High-Risk Times: Accidents are most frequent on weekends, particularly between 6 p.m. and 3 a.m., with over 50% of teen fatalities occurring during these hours.
- Weather Impact: Rain and fog significantly increase accident risk, particularly when combined with high speeds and reduced visibility. Wet conditions are responsible for about 21% of weather-related crashes.
For further details, visit NHTSA Traffic Statistics.
2. Traffic Statistic: Driver Behavior
- Speeding and Distracted Driving: Speeding and distractions contribute to accidents, with the economic cost of distracted driving reaching $98.2 billion. Nearly 6% of teens admit to rarely using seatbelts, and over half of fatalities involving teens include unbelted passengers.
- DUI Trends: Alcohol and drug impairment cost approximately $68.9 billion in 2019, with alcohol-related crashes accounting for $141 per person annually. Traffic statistics reveal the alarming trends in DUI incidents.
Check more at NHTSA Driver Statistics and NSC Reports.
3. Traffic Statistic: Flow and Congestion
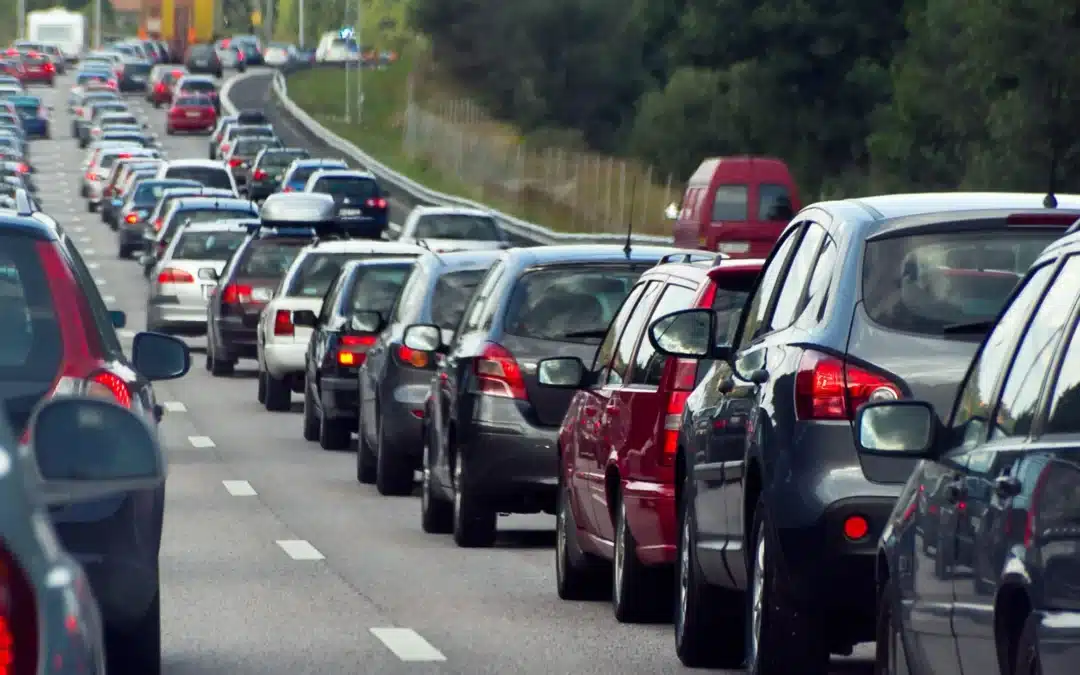
- Commute Delays: Major metro areas see peak hour delays, with drivers facing an annual average delay of 54 hours due to congestion. The holiday season exacerbates congestion, especially around Thanksgiving and summer months.
- Bottlenecks: Urban bottlenecks, such as intersections in Los Angeles and New York, lead to regular delays, impacting economic productivity and fuel costs.
For further insights, visit USDOT Traffic Analysis Reports.
4. Fatality Traffic Statistics
The overall fatality rate in the U.S. is 1.37 deaths per 100 million miles traveled. Certain demographics and transportation types are particularly vulnerable:
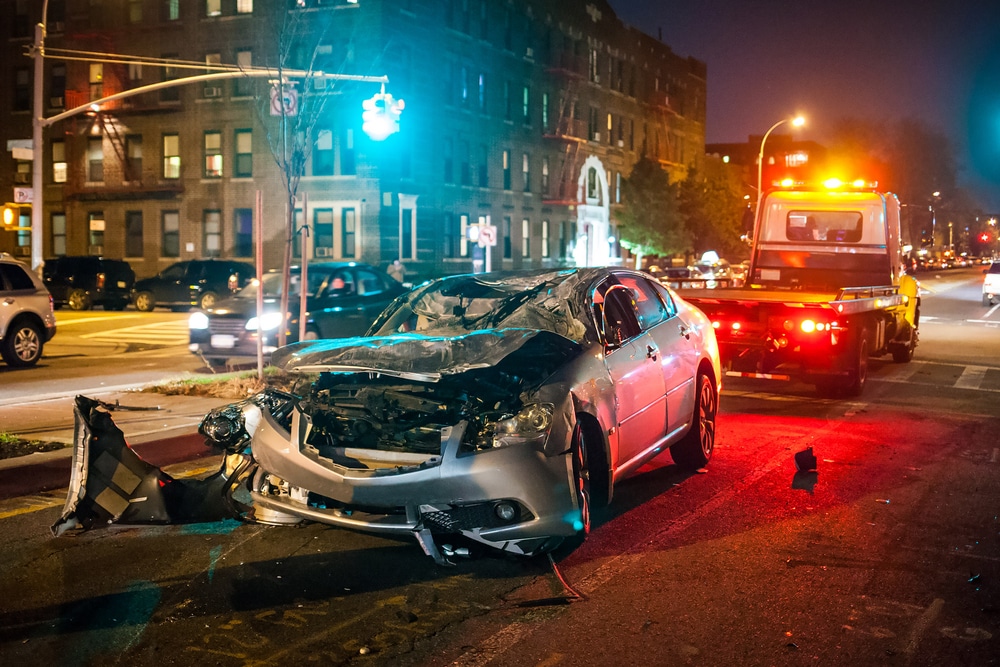
- Car Accidents: Car accidents are responsible for approximately 35% of all traffic fatalities. In 2021, there were over 42,000 deaths from car crashes, highlighting the dangers of distracted driving, speeding, and driving under the influence.
- Bus Accidents: Bus accidents, though less frequent, can have devastating impacts. They account for about 0.1% of all traffic fatalities, but when they occur, the fatality rate is often higher due to the larger number of passengers involved. In 2021, bus-related fatalities reached around 260.
- Truck Accidents: Large trucks (including semi-trucks) are involved in roughly 9% of fatal crashes, with approximately 5,600 deaths attributed to truck accidents in 2021. These accidents often result from factors such as driver fatigue, poor vehicle maintenance, and unsafe driving practices.
- Motorcycle Accidents: Motorcyclists are particularly at risk, representing 14% of all traffic fatalities despite being a small percentage of total vehicle registrations. In 2021, over 5,500 motorcyclists lost their lives, with the fatality rate for motorcyclists being five times higher than for passenger car occupants.
- Pedestrian Accidents: Pedestrian fatalities have seen a worrying increase, with over 7,300 deaths in 2021. Pedestrians account for approximately 17% of all traffic fatalities, and the risk is higher in urban areas where traffic density is greater and visibility is often reduced.
- Boating Accidents: While not a roadway statistic, boating accidents also pose a significant risk. In 2021, there were 658 fatalities due to boating accidents, with the majority of incidents attributed to operator inattention, lack of safety equipment, and alcohol use.
- Bicycle Accidents: Bicycle accidents accounted for approximately 800 fatalities in 2021, making up about 2% of total traffic deaths. These accidents often involve collisions with motor vehicles and highlight the need for improved infrastructure and safety measures for cyclists.
- Slip and Fall Accidents: Although not typically categorized with traffic accidents, slip and fall incidents contribute significantly to injury statistics. These accidents result in around 17,000 fatalities annually, often occurring in public spaces and workplaces. The cost of non-fatal slip and fall injuries is substantial, with an average societal cost of about $30,000 per incident.
5. Economic Costs of Traffic Incidents
- Annual Costs: Traffic incidents cost the U.S. roughly $340 billion annually, which equates to about $1,035 per person. Taxpayers indirectly shoulder three-quarters of these costs through insurance, taxes, and lost time.
- Breakdown of Economic Impact: Crashes involving alcohol have a substantial economic effect, costing around $141 per person yearly.
- Injury Severity: Non-fatal injuries impose a significant financial burden, costing approximately $162,000 per incident. In contrast, the societal cost per fatality is substantial, exceeding $1.869 million. This discrepancy highlights the need for enhanced safety measures across all forms of transportation and public spaces.
6. Comparison of Vehicle Characteristics: Age, Size, and Cost
- Older vs. Newer Cars:
Cars aged 10 years or older are twice as likely to be involved in fatal crashes compared to newer models. This increased risk is primarily due to fewer modern safety features, such as electronic stability control (ESC) and advanced airbags. For example, vehicles manufactured before 2010 often lack ESC, which can significantly reduce the likelihood of losing control in critical situations. Data shows that the fatality rate for older cars is about 22 deaths per million registered vehicles, while newer models, equipped with better safety technology, see a much lower rate. - Large vs. Small Vehicles:
Larger vehicles, such as SUVs and trucks, provide better protection for their occupants. The death rate for larger vehicles is around 28 deaths per million registered vehicles, compared to 60 deaths for smaller cars. However, it’s important to note that the size and weight of larger vehicles can contribute to higher fatalities for pedestrians. In fact, larger vehicles are more likely to be involved in pedestrian accidents, resulting in a fatality rate for pedestrians that is 2.5 times higher compared to smaller cars. - Luxury vs. Economy Models:
Luxury vehicles generally demonstrate lower fatality rates due to their advanced safety systems and technology. For example, luxury models such as the Lexus RX and Volvo XC90 maintain some of the lowest fatality rates in the industry, often attributed to features like adaptive cruise control, automatic emergency braking, and enhanced structural integrity. Conversely, budget models, such as the Mitsubishi Mirage, exhibit higher driver fatality rates, primarily due to fewer safety features and lower crash-test ratings. Data indicates that budget vehicles can have fatality rates exceeding 80 deaths per million registered vehicles.
Accident?
Our team of experienced pedestrian accident lawyers is ready to help you assess your case via traffic statistics and fight for the compensation you deserve. Don’t let the negligence of others dictate your future—let us be your advocate in this challenging time.
Full Sourcing list of Traffic Statistics:
1. Accident Rates and Causes
- NHTSA Traffic Statistics: U.S. Department of Transportation, National Highway Traffic Safety Administration (NHTSA). “Traffic Safety Facts 2022.” NHTSA.gov
2. Driver Behavior Statistics
- NHTSA Driver Statistics: National Highway Traffic Safety Administration (NHTSA). “Driver Behavior and Safety Statistics.” NHTSA.gov
- NSC Reports: National Safety Council (NSC). “Trends in Distracted Driving.” nsc.org
3. Traffic Flow and Congestion Data
- USDOT Traffic Analysis Reports: U.S. Department of Transportation (USDOT). “Traffic Congestion and Reliability: Trends and Advanced Strategies.” USDOT.gov
4. Fatality Statistics
- NHTSA: National Highway Traffic Safety Administration. “Fatal Motor Vehicle Crashes in the United States.” NHTSA.gov
- CDC: Centers for Disease Control and Prevention. “Motor Vehicle Safety.” CDC.gov
5. Economic Costs of Traffic Incidents
- NHTSA: National Highway Traffic Safety Administration. “The Economic Impact of Motor Vehicle Crashes.” NHTSA.gov
- National Safety Council: “Cost of Traffic Crashes.” nsc.org
6. Comparison of Vehicle Characteristics: Age, Size, and Cost
- Insurance Institute for Highway Safety (IIHS): “Vehicle Safety Ratings and Trends.” IIHS.org
- NHTSA: National Highway Traffic Safety Administration. “Vehicle Crashworthiness and Safety Features.” NHTSA.gov


